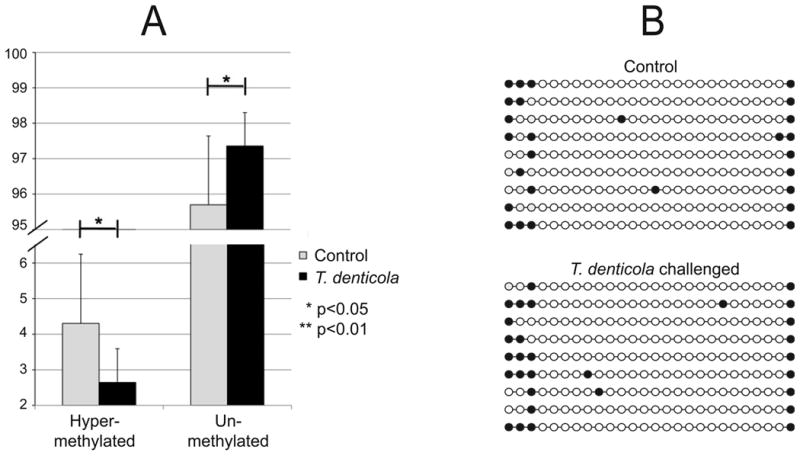
Figure 4. Analysis of MMP-2 promoter methylation in PDL cells following T. denticola challenge.

PDL cells were challenged with T. denticola for 2h, washed, and incubated in fresh medium for 24 h prior to analysis. The vertical scale indicates percent of total DNA. Panel A: methylation analysis of the MMP-2 promoter region as determined by MethylDNA Restriction Screen (Qiagen). Results are expressed as the percentage of hyper-methylated and unmethylated DNA, which sum to 100%. Data were analyzed using Student's t-test. Panel B: DNA methylation analysis of the MMP-2 promoter region as determined by sequencing of independent PCR clones of bisulfite-converted DNA from T. denticola challenged and unchallenged PDL cell cultures. Each circle represents an individual CpG within residues 236-456 of MMP2-exon 1-transcript variant 1. Open and closed circles indicate unmethylated and methylated CpGs, respectively within residues 236-456 of MMP2-exon 1.
