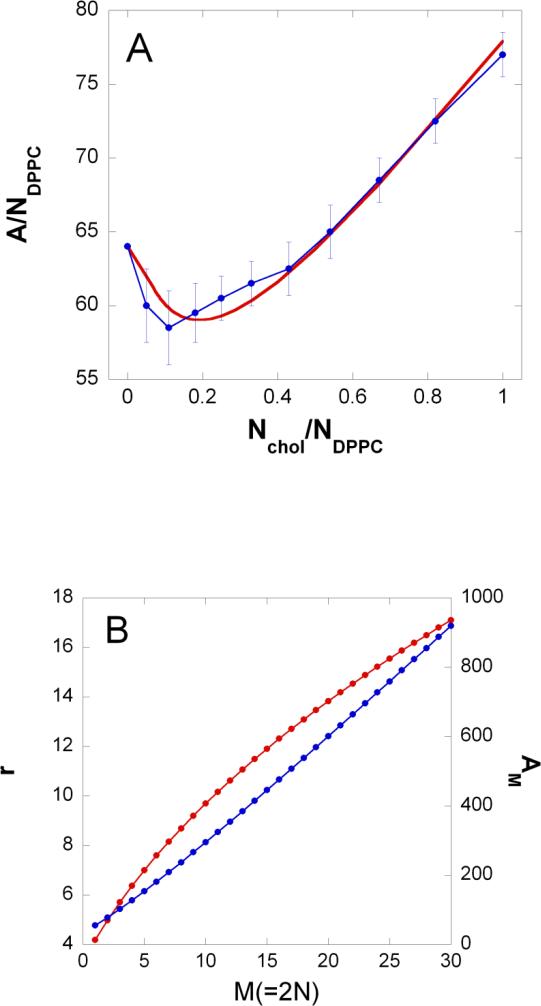
Figure 1. Condensing effect of cholesterol.
a) The total membrane surface area, A divided by the number of DPPC molecules, NDPPC versus the number of cholesterol molecules, Nchol divided by the number of DPPC molecules. Blue dots: from molecular dynamics calculations 44; Red line: calculated from Eq.2 (see text) by using parameter values τ=5Å and Ac = 34 Å2. The membrane surface area, A is given in Å2.
b) Red and blue curve is the radius, r and cross sectional area, AM(= r2π), respectively of a rigid cluster as a function of the number of hydrocarbon chains condensed to a cholesterol, M(=2N). These curves were calculated from Eq.2 (see text) by using parameter values τ = 5Å and Ac = 34 Å2. r and AM is given in Å and Å2, respectively.

