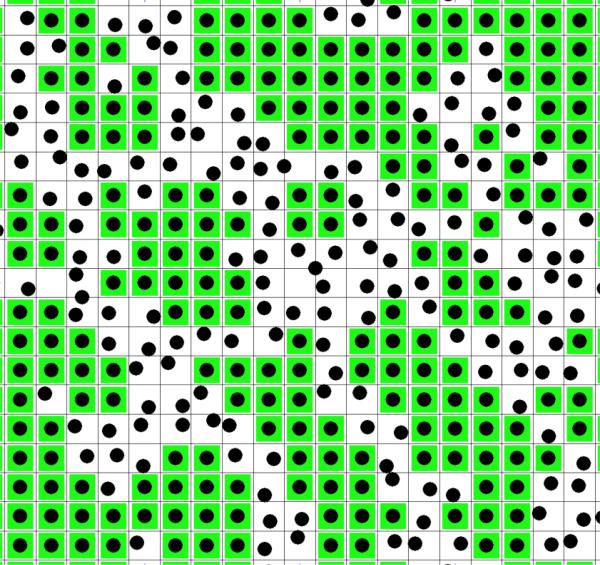
Figure 2. Lattice model of phospholipid/cholesterol membrane.
A layer of the membrane is represented by units of squares (black lines). The surface area of a unit is equal with the surface area of a rigid cluster, AM (see Figure 1b). A unit represents either a rigid cluster (green unit with black dot at the center) or part of the fluid phase (white unit with randomly distributed black dot). Black dot: cholesterol. Green square: phospholipid molecules condensed to the central cholesterol.

