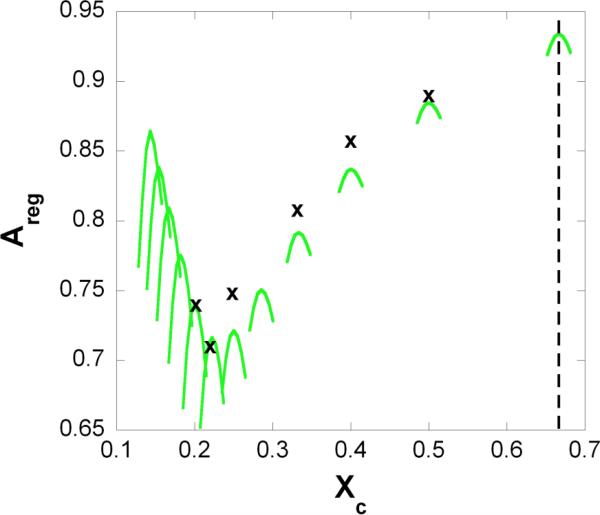
Figure 3. Proportion of regularly packed membrane area.
Regular area fraction, Areg is plotted against the cholesterol mole fraction, Xc. x: measured local maxima of the regular area fraction 13; green lines: the curve of regular area fractions calculated by Eq.18. Dashed line: cholesterol precipitates from the bilayer above this mole fraction (as noted in the text, this actual limit is characteristic for cholesterol/PC bilayers). The values of the model parameters are listed in Table 1.

