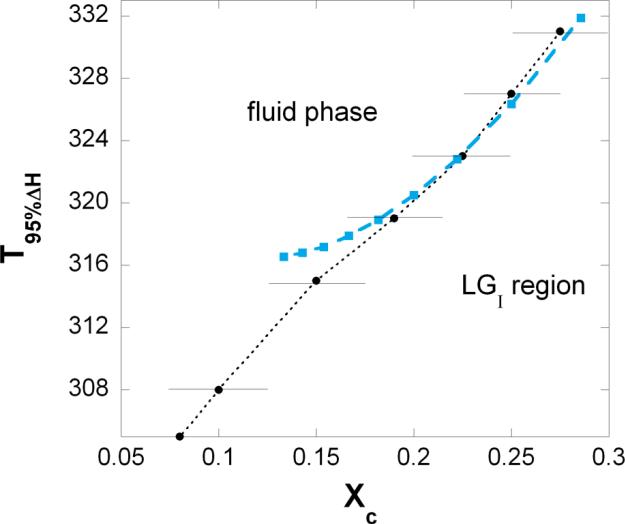
Figure 4. Calculated and measured phase boundary.
Close to the critical cholesterol mole fractions one can calculate the temperature, T95%ΔH where 95% of the phospholipids are in fluid state, i.e. the temperature where (see Eq.19). Above T95%ΔH the LGI phase turns into fluid phase. This calculated temperature is plotted against the critical mole fraction, (blue squares). Representative experimental data points are shown with error bars (black dots from 34). Detected phase boundary is marked by dotted line.

