Figure 4.

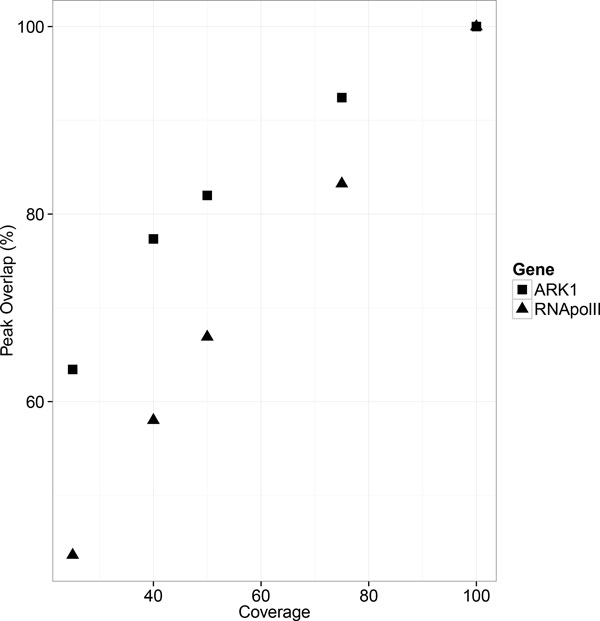
Effect of sequencing coverage on ChIP-seq peaks robustness. X-axis represents percentage of sequencing reads while Y-axis represents the percentage of ChIP-seq peaks detected from the 100% coverage dataset.

Effect of sequencing coverage on ChIP-seq peaks robustness. X-axis represents percentage of sequencing reads while Y-axis represents the percentage of ChIP-seq peaks detected from the 100% coverage dataset.