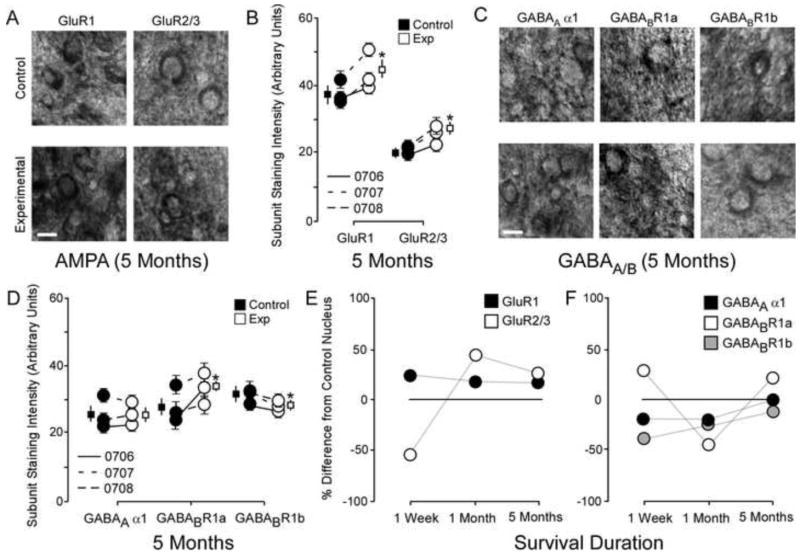
Figure 2.
The changes to AMPA and GABAA/B receptor subunits 5 months after nerve injury. A: Photomicrographs showing qualitative examples of GluR1 and GluR2/3 soma staining between control and experimental cuneate nucleus 5 months after nerve injury: scale bar 5 μm. B: Quantitative plot comparing GluR1 and GluR2/3 staining intensity data for all animals 5 months after nerve injury. * p < .05. C: Photomicrographs showing qualitative examples of GABAA α1, GABABR1a, and GABABR1b soma staining between control and experimental cuneate nucleus 5 months after nerve injury: scale bar 5 μm. D: Quantitative plot comparing GABAA α1, GABABR1a, and GABABR1b staining intensity data for group averages and raw averages 5 months after nerve injury. * p < .05. E: Qualitative line-plots comparing percent differences from control values for GluR1 and GluR2/3 staining intensity data one week, one month, and five months after nerve compression. F: Qualitative line-plots comparing percent differences from control values for GABAA α1, GABABR1a, and GABABR1b staining intensity data one week, one month, and five months after nerve compression.

