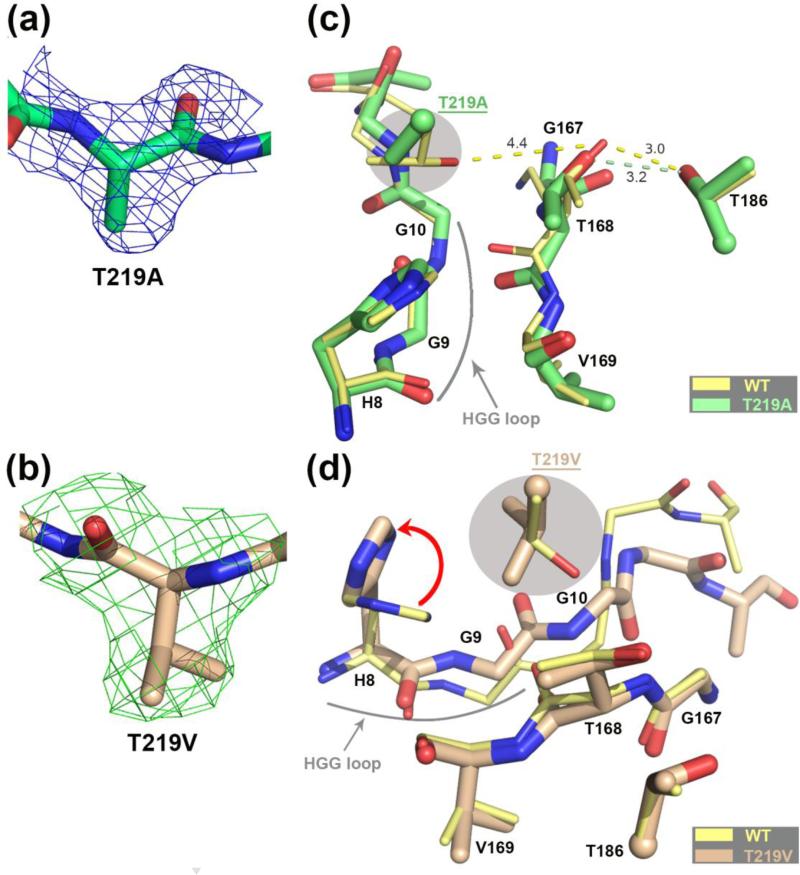
FIGURE 4.
Comparison of the hASNase3 T219A/V mutants to the WT uncleaved high-resolution structure. (a) Fo-Fc omit map contoured at 2.2σ around alanine at position 219. Residue 219 from Protomer A was removed from the model that then underwent several rounds of refinement to eliminate model bias. (b) Fo-Fc omit map contoured at 2.2σ around valine at position 219. Residue 219 from Protomer A was removed from the model that then underwent several rounds of refinement to eliminate model bias. (c) WT hASNase3 uncleaved structure (thin yellow sticks) and the T219A mutant (thick green sticks) are superimposed and a close-up around the cleavage region is presented. Side chains of residues 186 and 219 (highlighted in grey) are presented with the α-carbon displayed as a sphere. Distances between residue 168 and residues 186 and 219 are in Angstroms and represented in dashed lines. The highly conserved HGG loop is also represented. (d) WT hASNase3 uncleaved structure (thin yellow sticks) and the T219V mutant (thick tan sticks) are superimposed and a close-up around the cleavage region is presented. The valine side chain at position 219 (highlighted in grey) rotates ~135° compared to the original threonine, forcing the side chain of His8 to rotate 90° to avoid steric clashes (red arrow). In this conformation the Gly9 carbonyl also has to rotate ~60° facing the opposite side of Thr168 resulting in a change in conformation of the residues following Gly9 (see also Figure 5d).

