
Figure 5. SAP variant binding to FcγRIIa and FcγRI.
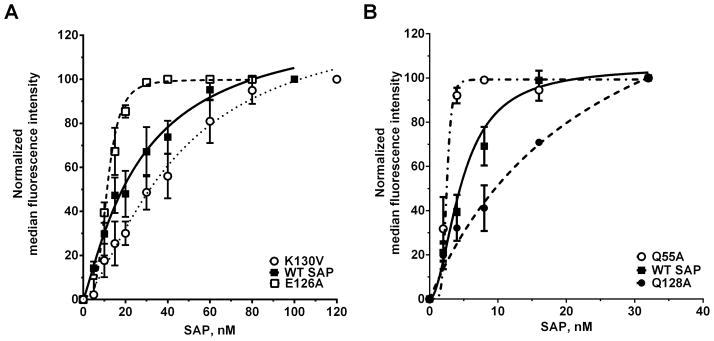
A) K562 cells, which express FcγRIIa, were incubated with fluorescently-labeled SAP variants. The cells were then washed and the binding of the labeled SAP to the cells was measured by flow cytometry. B) HEK293 cells expressing FcγRI were incubated with fluorescently-labeled SAP variants and then binding was measured by flow cytometry. Mock transfected cells were used to estimate the non-specific binding. Median fluorescne intensity values were normalized to the intensity value of the highest SAP concentration. Values are normalized mean ± SEM, n=3–5. Curves are fits to models of one-site binding with variable Hill coefficient. The absence of error bars indicates that the error was smaller than the plot symbol.