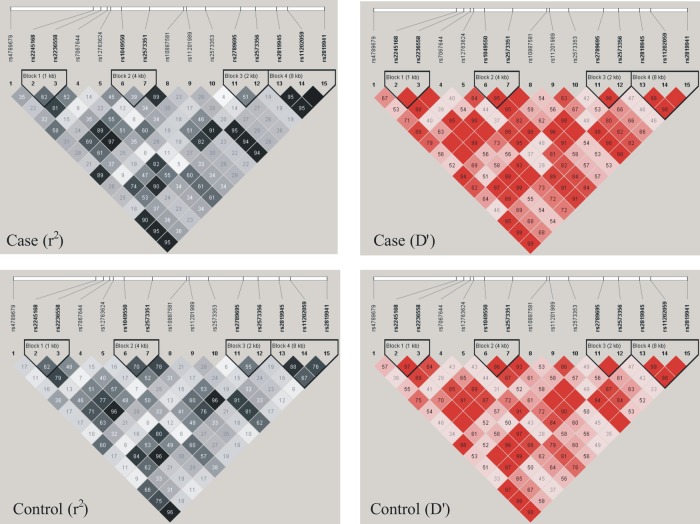
Figure 1.
The LD plot of the 15 SNPs in the ANXA11 gene. Values in squares are the pairwise calculation of r2 (left) or D′ (right). Black squares indicate r2=1 (ie, perfect LD between a pair of (single-nucleotide polymorphisms SNPs)). Empty squares indicate D′=1 (ie, complete LD between a pair of SNPs).

