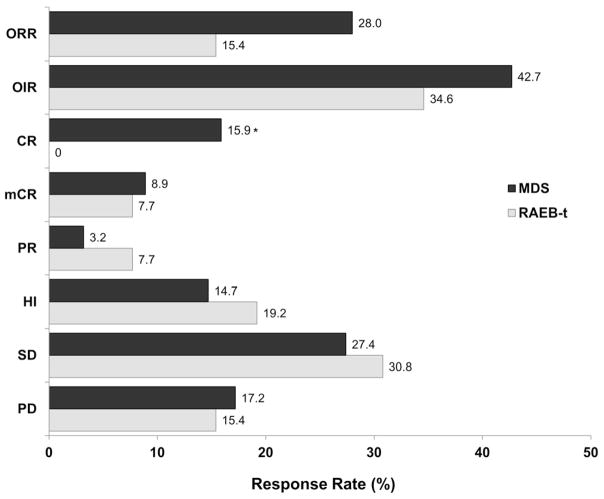
Figure 1. Pooled analysis of decitabine response rates in patients with RAEB-t and in patients with myelodysplastic syndromes (MDS).
Significant differences in response rates between the RAEB-t and MDS groups were observed only for complete response (P = .028).
CR, complete response; HI, hematologic improvement; mCR, marrow complete response; OIR, overall improvement rate; ORR, overall response rate; PD, progressive disease; PR, partial response; RAEB-t, refractory anemia with excess of blasts in transformation; SD, stable disease.

