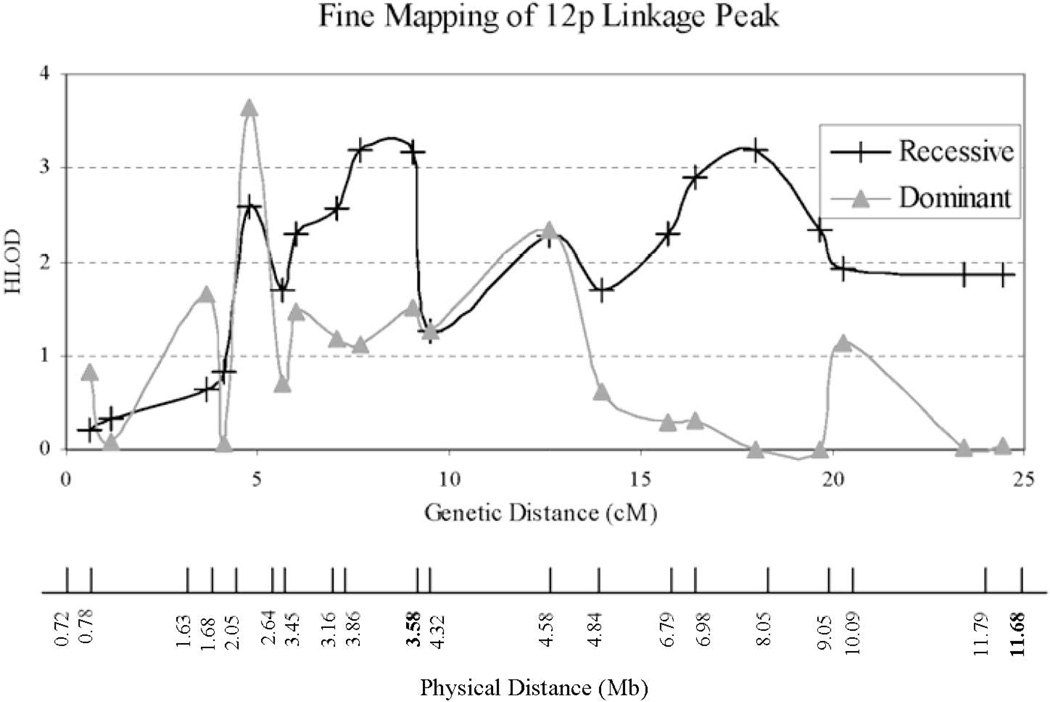
Figure 3.
Fine mapping results of 12p3 region. Both physical and genetic distances from 12pter are given. Single-point analysis yields both LOD and HLOD of 3.2 at 12p (GATA49D12N). The heterogeneity parameter alpha is 1.0. NPL score is 1.38 with p-value of 0.053. The dominant model yields a linkage peak with HLOD = 3.7 (α = 1.0) at 5 cM, while the recessive model reveals a pair of peaks with HLOD = 3.2 (α = 1.0) at 8 and 18 cM. Marker positions are those provided by deCode. The exact chromosome position can be found in Table 2. The genetic and physical distances are not linearly related due to varying recombination rates along the length of the chromosomes. Moreover, there are discrepancies in marker order between the genetic and physical maps shown as boldfaced physical map position labels.

