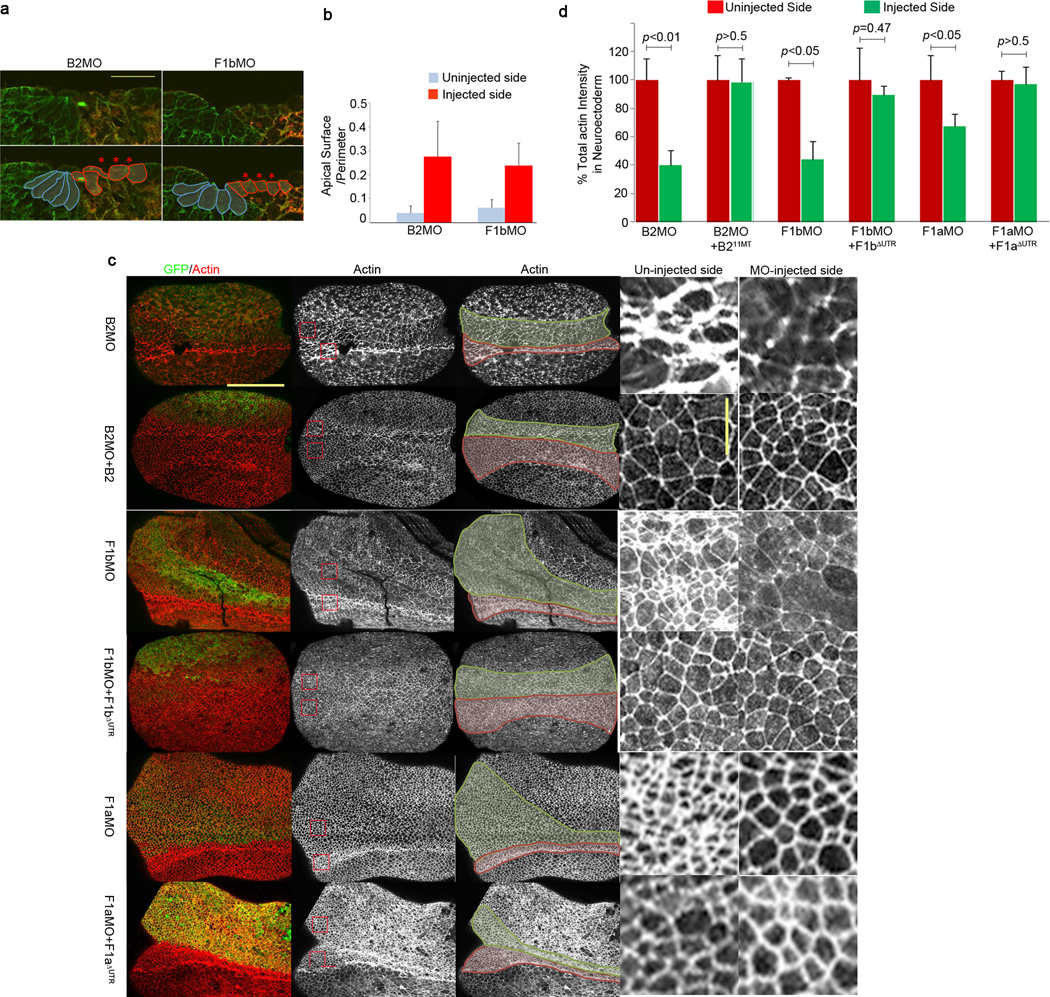
Figure 8. Neuroepithelial cells of flotillin-1 and ephrinB2 morphants fail to apically constrict in the presumptive neural tube.
(a) Apical constriction defects of ephrinB2 and flotillin-1 morphants. B2MO or F1bMO were injected into one side of the embryos along with GFP RNA as a tracer. At the neurula stage, embryos were stained with anti-tubulin (green) antibody to outline the cells and with anti-GFP (red) antibody to label the injected side. Cell shapes are outlined below. Blue; uninjected cells, red; MO injected cells. Scale bar represents 50 µm. (b) The average ratios of the apical surfaces to the perimeters among five different cells on each side of the midline were calculated for five different embryos. Blue bars; uninjected side, red bars; MO injected side. (c) Decreased actin intensity in ephrinB2 or flotillin-1 morphants. Each embryo was injected with the indicated MO and GFP RNA with or without the appropriate rescue RNA as indicated. GFP (green) shows the injected side, and actin is stained red (phalloidin staining). In the third column, the neuroepithelum is outlined in green on the MO-injected side and red on the uninjected side. Red boxed regions from embryos in the second column are presented as enlarged images in the fourth and fifth columns. Horizontal scale bar represents 300 µm and vertical scale bar 50 µm. (d) Total actin intensity is decreased in ephrinB2 or flotillin-1 morphants. Percent total actin intensities were calculated for the uninjected or injected side of the embryo using the methodology described in the Methods section. A two-tailed t-test was used to generate the P value. These results represent three independent experiments. Error bars represent s.d.

