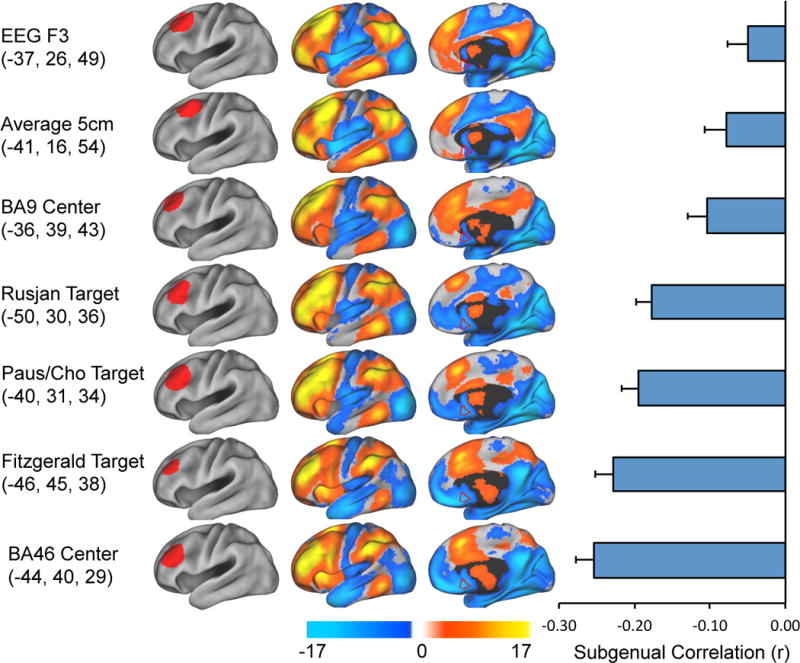
Figure 1.

Different left DLPFC TMS targets show variability in resting state functional connectivity, especially with the subgenual cingulate. The left hand column shows the coordinates and regions of interest for various left DLPFC TMS targets employed in the literature. The middle columns show resting state functional connectivity maps for each DLPFC region of interest. The border of our a-priori defined subgenual region of interest is show for reference in red. The right hand column is the correlation coefficient between the timecourse from each DLPFC region of interest and that of the subgenual cingulate.
