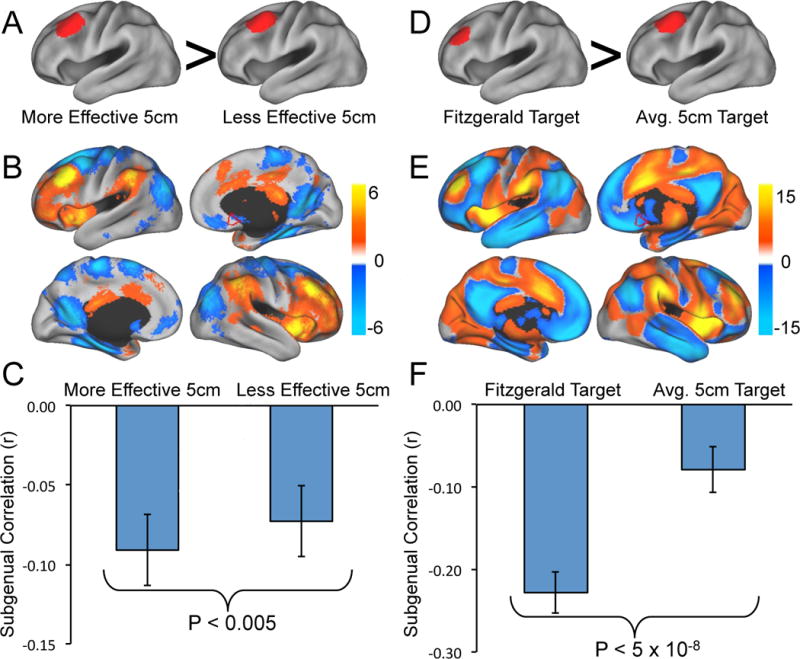
Figure 2.

Differences in resting state functional connectivity between more effective versus less effective DLPFC stimulation sites. Coordinates are taken from Herbsman et al. 2009 (A–C) and Fitzgerald et al. 2009 (D–F). The top row (A, D) shows the DLPFC regions of interest compared in each study. The middle row (B, E) shows significant differences in resting state functional connectivity between the two sites (more effective – less effective). The border of our a-priori defined subgenual region of interest is show for reference in red. The bottom row (C, F) shows bar graphs of the correlation of each DLPFC site with the subgenual cingulate. In both cases the more effective DLPFC site is significantly more anticorrelated with the subgenual cingulate than the less effective site.
