
FIGURE 5.
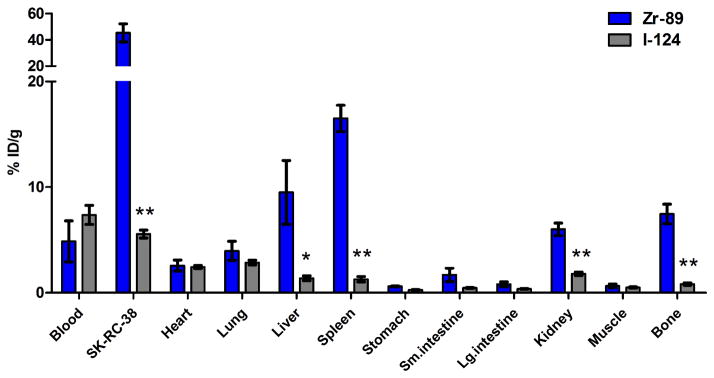
Biodistribution data following serial PET imaging (11 d for 89Zr-cG250 and 10 d for 124I-cG250). Groups consisted of 4 or 5 mice each. Data for 124I-cG250 is from group of animals with normal thyroid at time of tracer injection. The data are expressed as the mean %ID/g ± SEM. (*) p < 0.05, (**) p < 0.005.