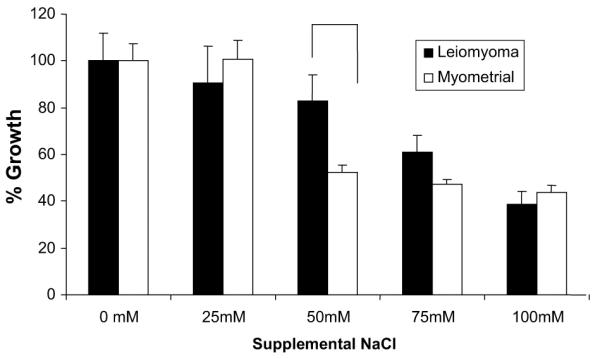
FIGURE 3.

Leiomyoma and myometrial cell proliferation under osmotic stress. Cell growth was inhibited in a dose-dependent manner in both cell types. At 50 mM NaCl, leiomyoma cells demonstrated greater resistance to osmotic stress. Leiomyoma and myometrial cells were cultured in media with added NaCl (x axis). Leiomyoma and myometrial cell proliferation are depicted as the percentage growth (y axis) relative to cell proliferation under isotonic conditions (0 mM supplemental NaCl) in leiomyoma and myometrial cells, respectively. This figure depicts cell proliferation at 24 hours and is representative of proliferation curves at 48, 72, and 96 hours. Proliferation studies were performed in triplicate, and the representative data are shown. Data shown represent the average rate of growth ± standard error of the mean. Proliferation was determined by the sulforhodamine B assay method.
McCarthy-Keith. Osmoregulation in leiomyoma cells. Fertil Steril 2011.
