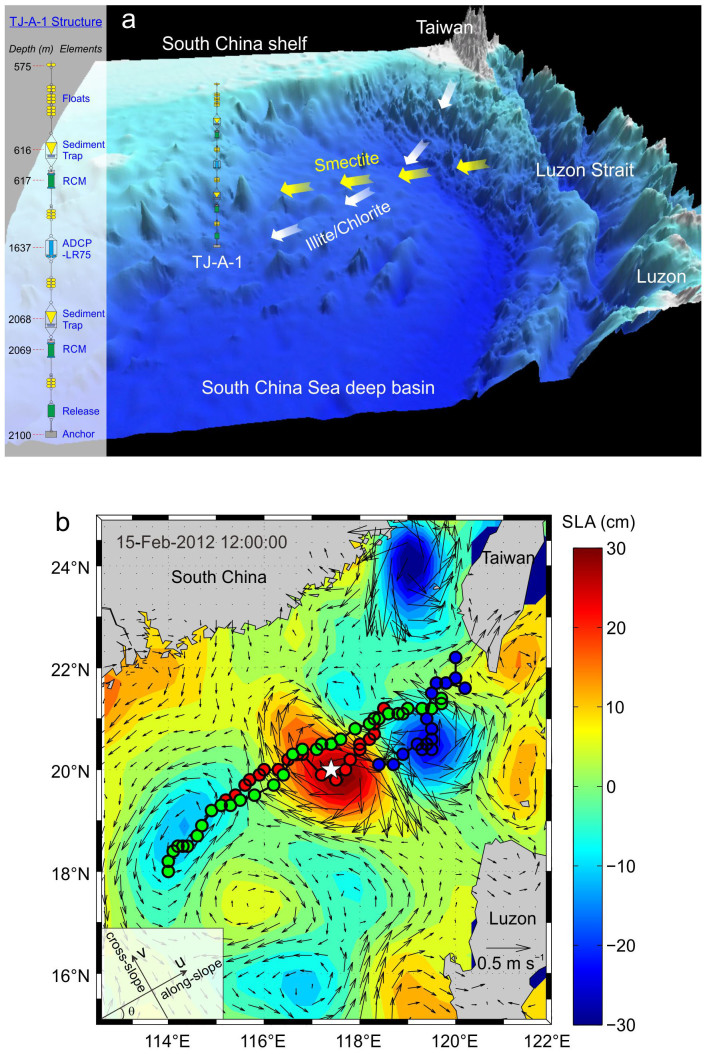
Figure 1. Seafloor topography and sea surface level anomaly in the northeastern South China Sea (SCS).
(a) Seafloor topography showing the location of the TJ-A-1 mooring system and its vertical structure (left side). The three-dimensional topography map is created from the 30-arc-second resolution global topography/bathymetry grid (STRM30_PLUS)13 using Global Mapper 12. Two RCMs are equipped with probes for turbidity and temperature measurement (see Methods for more details of the mooring system). Potential sediment transport pathways of illite and chlorite derived from Taiwan and smectite originated from Luzon are also displayed14. (b) Map of sea level anomaly (SLA) with surface geostrophic current velocity (shown as black arrows) on 15 February 2012 when an anticyclonic eddy passed by the mooring site (white star). The map is generated through combining SLA and surface geostrophic current velocity data distributed by AVISO (http://www.aviso.oceanobs.com) using Matlab R2010b. Centroidal tracks of three eddies from birth until death, marked every 3 days (circles), are superimposed on the map. Red and blue circles stand for an anticyclonic and a cyclonic eddy born in November 2011, respectively; green circles represent an anticyclonic eddy born in November 2012. The inset figure in the lower part of (b) shows the u (along-slope) and v (cross-slope) coordinates (see Methods for detailed descriptions).

