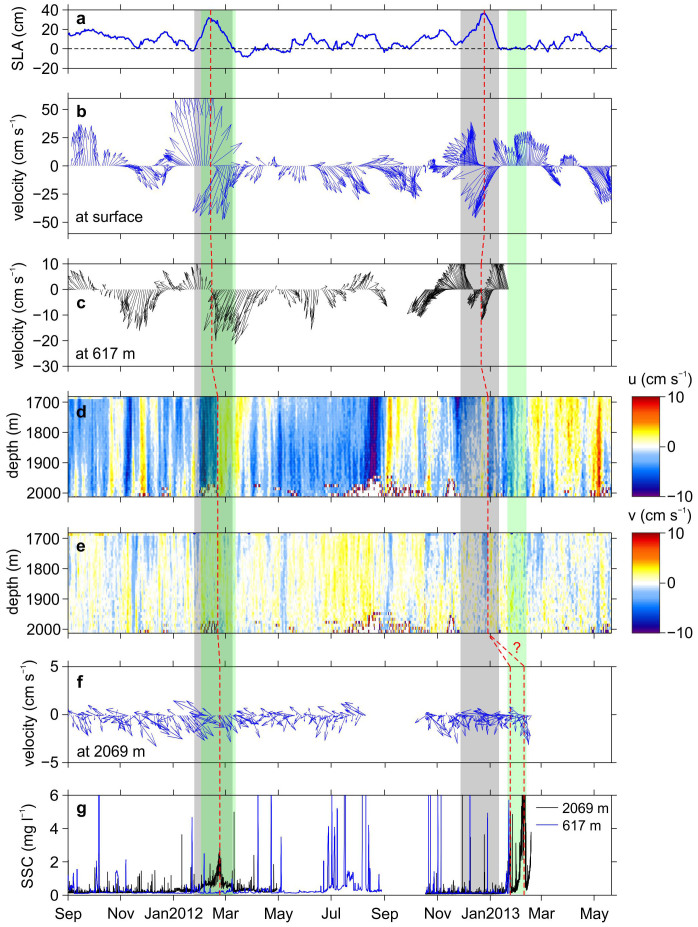
Figure 2. Time series of SLA, current velocity, and suspended sediment concentration (SSC) variations from September 2011 to May 2013.
Shaded regions show the periods when two energetic anticyclonic eddies passed through the mooring site (gray) and the periods with enhanced SSC near the seafloor (green) following the eddy activities. Red dashed lines indicate the influence of the anticyclonic eddies through the full water column. (a) Surface SLA showing two anticyclonic eddies passed through during the observation period: one in January to March 2012 and the other in November 2012 to January 2013. (b) Surface geostrophic velocity derived from the SLA. (c) Current velocity recorded at 617 m water depth by a RCM. (d) Along-slope velocity (u) profile recorded by a down-looking ADCP-LR75 positioned at 1637 m water depth (~460 m above seafloor). (e) Same as (d) but for cross-slope velocity (v) profile. (f) Current velocity recorded at 2069 m water depth by a RCM. (g) The SSC recorded by turbidity probes associated with RCMs positioned at 617 m (blue curve) and 2069 m (black curve) water depths, respectively. A question mark (?) to the red dashed line in the green shaded region shows an uncertainty of correlation. See Figure 1a for details of instrument positions in the mooring system.

