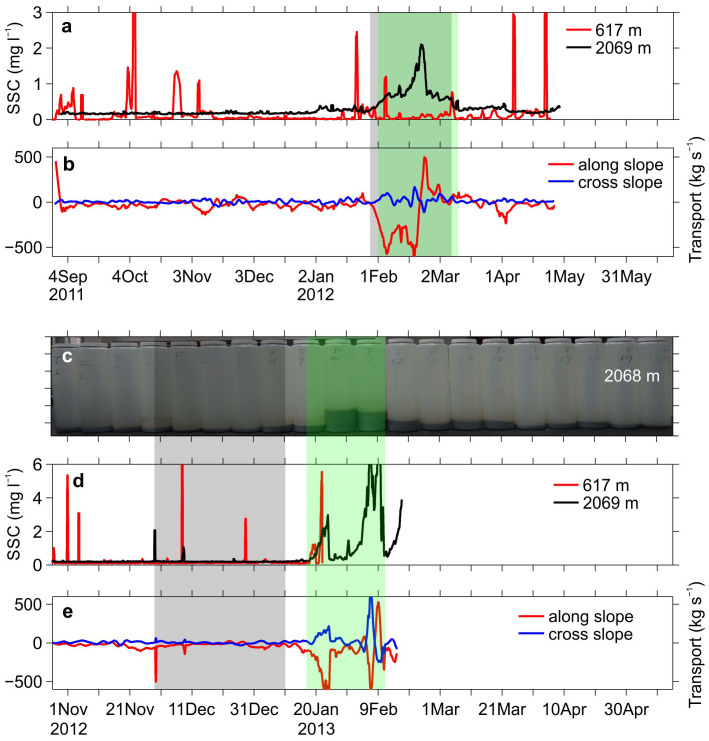
Figure 4. Time series of suspended sediment responses to passing-through of two anticyclonic eddies.
During passing-through of the first eddy: (a) SSC near-bottom (black curve) and upper layer (at 617 m, red curve), same as Figure 2g but with 3-day filtered; (b) sediment transport mass estimated from the SSC shown in (a) and corresponding near-bottom velocities. During passing-through of the second eddy: (c) bottled sediment samples collected by the lower-layer sediment trap positioned at 2068 m (~32 m above the seafloor); (d) SSC near-bottom (black curve) and upper layer (at 617 m, red curve), same as Figure 2g but with 3-day filtered; (e) sediment transport mass estimated from the SSC shown in (d) and corresponding near-bottom velocities. The lower-layer sediment trap during the first deployment (September 2011 to October 2012) failed in the operation, and then no bottled sediment samples are provided when the first eddy passed through. Shaded regions are same as in Figure 2.

