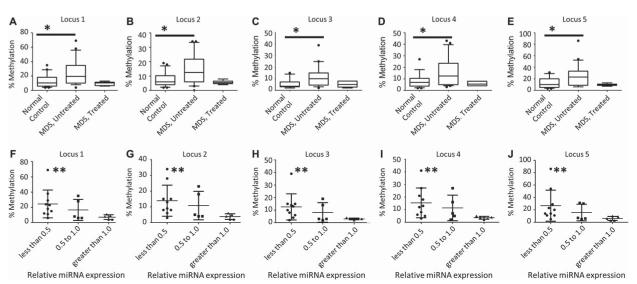
Figure 2.
(A–E) Methylation of five CpG sites on the ZNF207/miR-632 promoter (Chr17: 30677150–30677195) showing hypermethylation of MDS samples (n = 20) in this region compared to normal controls (n = 22) and compared to samples from patients with MDS actively receiving DNMTIs (n = 6). p-Values (*) from Student’s t-test are 0.017, 0.013, 0.009, 0.029 and 0.020 for loci 1 through 5, respectively (see also Table III). Plots demonstrate the median (line) with 1st and 3rd quartiles within the box and 10–90 percentile whiskers. (F–J) Comparison of miR-632 relative expression and methylation status for 20 MDS and control samples demonstrating significantly increased methylation for those samples demonstrating less than 0.5 relative expression by one-sample t-test (**p-values are 0.0081, 0.019, 0.046, 0.023 and 0.021 for loci 1 through 5, respectively). Plots demonstrate mean with standard deviation.

