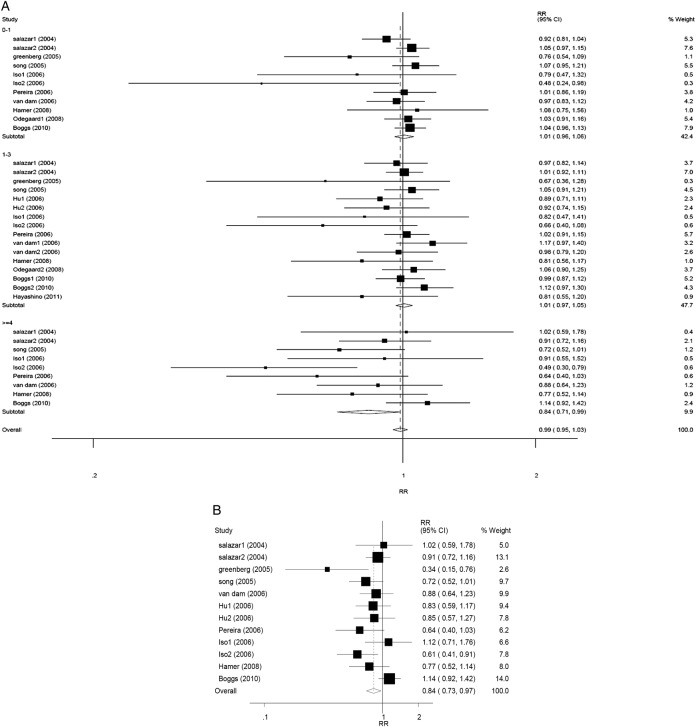
Figure 2.
Forest plots of RR (relative risk) with 95% CI of T2DM associated with the tea consumption stratified (A) by the frequency of tea consumptiona in random model and (B) by random-effect model (≥3 cups/day of tea consumption vs the reference). aThe frequency of tea consumption was classified as non/lowest, 0–1, 1–3 and ≥4 cups/day. Non/lowest of tea consumption group was regarded as the reference. Black square means value of RR, and the size of the square means inversely proportional to its variance. Horizontal line means 95% CI of RR. Black diamond means pooled results. The studies were ordered by published year.

