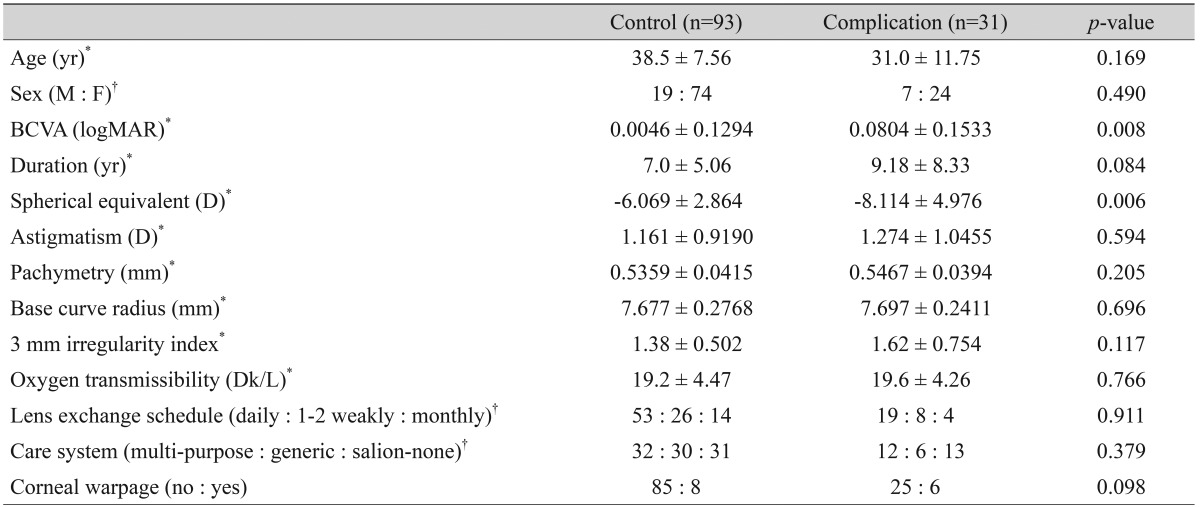
Table 1.
Demographics of the enrolled patients

BCVA = best-corrected visual acuity; logMAR = logarithm of minimal angle of resolution; D = diopter.
*Continuous outcomes were compared using the independent t-test; †Categorical outcomes were compared using Fisher's exact test.
