
Fig. 2.
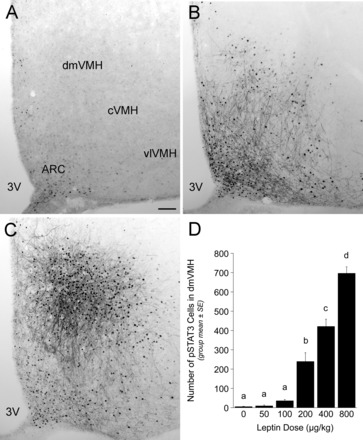
Representative images of pSTAT3 labeling within the dorsomedial subregion of the ventromedial hypothalamus (dmVMH) after intraperitoneal injection of saline vehicle (A), 200 μg/kg body wt leptin (B), or 800 μg/kg body wt leptin (C). Images depict the dmVMH ∼2.45 mm caudal to bregma. D: bar graph illustrating the number of pSTAT3-positive cells within the dmVMH after intraperitoneal injection of leptin at doses from 0–800 μg/kg body wt. Leptin dose-dependently increased dmVMH pSTAT3 labeling. Bars with different letters are significantly different (P < 0.05). 3V, third ventricle; ARC, arcuate nucleus of the hypothalamus; cVMH, central subregion of the ventromedial hypothalamus; vlVMH, ventrolateral subregion of the ventromedial hypothalamus. Scale bar in A = 100 μm, which applies also to B and C.