
Fig. 4.
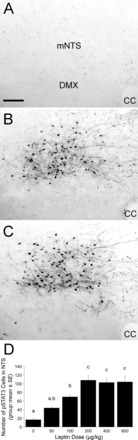
Representative images and summary data for pSTAT3 labeling within the NTS after intraperitoneal injection of saline vehicle (A), 200 μg/kg body wt leptin (B), or 800 μg/kg body wt leptin (C). Images depict the caudal NTS ∼14.36 mm caudal to bregma. D: bar graph illustrating the number of pSTAT3-positive cells within the NTS after intraperitoneal injection of leptin at doses from 0 to 800 μg/kg body wt. Leptin dose-dependently increased NTS pSTAT3 labeling. Bars with different letters are significantly different (P < 0.05). CC, central canal; mNTS, medial subnucleus of the nucleus of the solitary tract; DMX, dorsal motor nucleus of the vagus nerve. Scale bar in A = 100 μm, which applies also to B and C.