
Fig. 5.
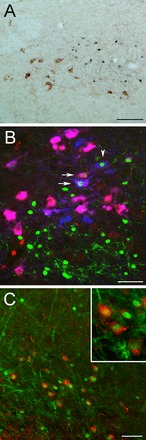
Representative color images of pSTAT3 and phenotypically identified neurons within the brain stem and hypothalamus. A: pSTAT3 (blue-black) is not colocalized in GLP-1-positive (brown) NTS neurons in rats after any dose of leptin (this image is from a rat treated with leptin at 200 μg/kg body wt; ∼14.36 mm caudal to bregma). B: pSTAT3 (green) is colocalized in some DβH-positive (blue) and DβH/PrRP-positive (purple-pink) neurons within the caudal NTS after leptin treatment (800 μg/kg body wt; ∼14.36 mm caudal to bregma). The majority of DβH- and DβH/PrRP-positive neurons did not colocalize pSTAT3, and vice versa. Arrows indicate pSTAT3+DβH/PrRP-positive neurons; the arrowhead indicates a pSTAT3+DβH-positive neuron that is not immunolabeled for PrRP. C: pSTAT3 (green) is colocalized with many CART-positive ARC neurons (red) after intraperitoneal leptin (400 μg/kg body wt; ∼2.45 mm caudal to bregma). Inset: higher-magnification view of several double-labeled ARC neurons. Scale bar in A = 100 μm. Scale bars in B and C = 50 μm.