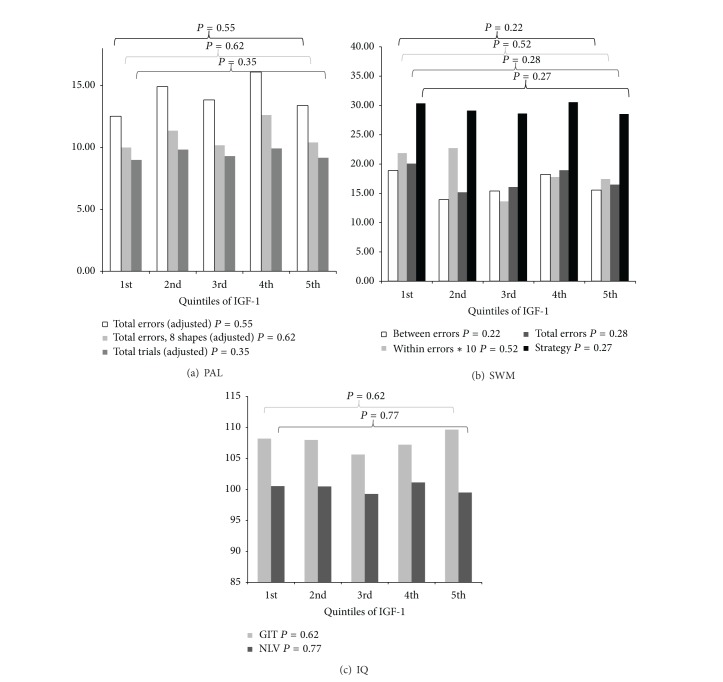
Figure 1.
Mean adjusted∗ cognitive scores per quintile of IGF-1 serum level. Quintiles of IGF-1 were made for men and women separately and merged afterwards. P values represent overall P values based on ANOVA statistics for the comparison of the GIT and NLV between quintiles of IGF-1 and MANOVA statistics for the comparison of PAL and SWM scores between quintiles of IGF-1. ∗Adjusted for age, gender, and BMI.

