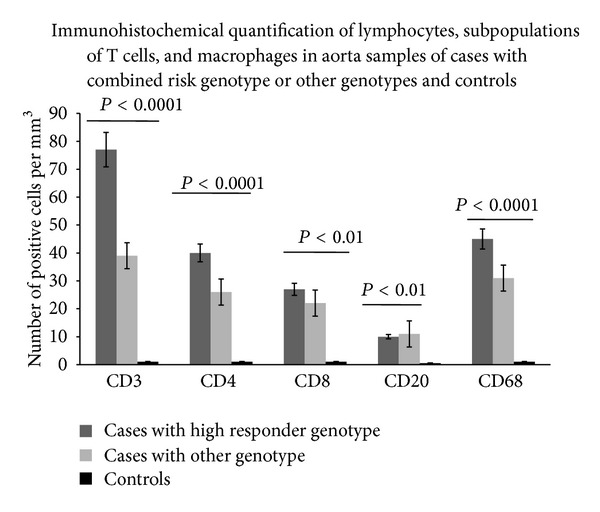
Figure 3.

Morphometric quantification of lymphocytes, T cell subpopulations, and macrophages in aorta samples of cases with high responder genotype, other genotypes, and controls. CD3, CD4, CD8, CD20, and CD68 positive cells in media and adventitia and in 10 contiguous high-power fields (magnification 400x) were counted by two independent observers. Significant increased amounts of CD3+CD4+CD8+CD68+CD20+ cells were observed by comparing their values among the three groups (by ANOVA test). In particular, cases with high responder genotype had higher numbers of these cells than controls and cases with other genotypes.
