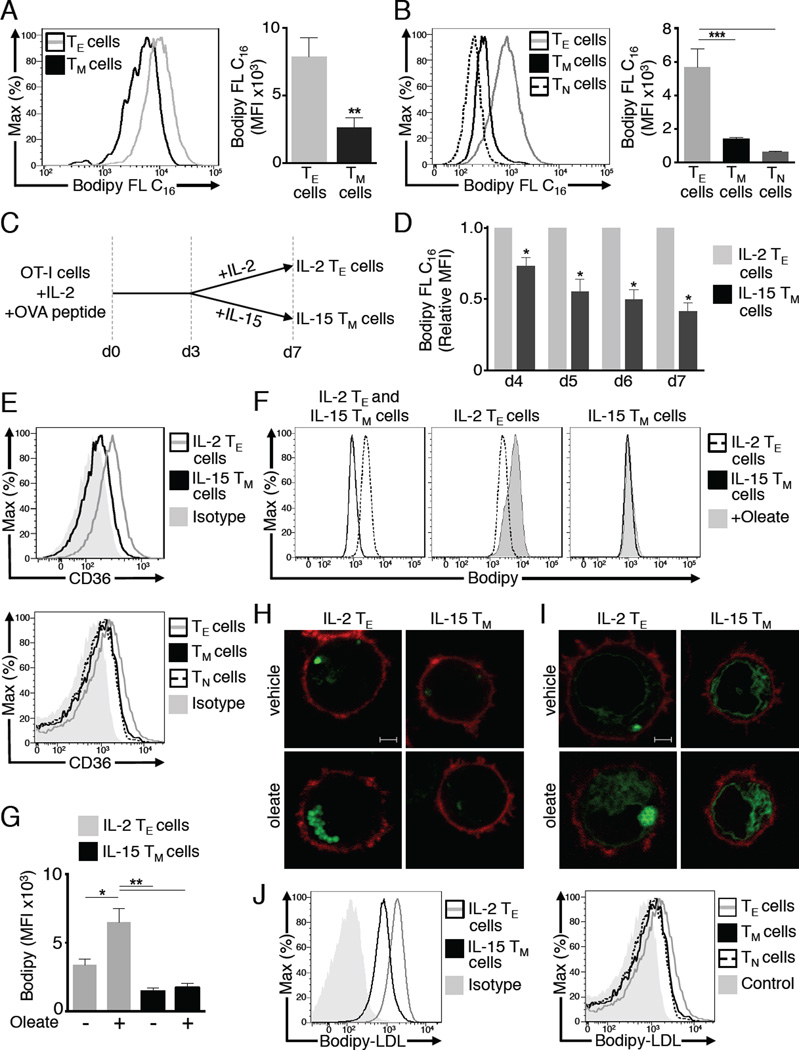
Figure 1. Unlike CD8+ TE cells, CD8+ TM cells do not acquire substantial amounts of extracellular fatty acids.
OT-I cells were injected i.v. into congenic recipients. Mice were infected with LmOVA to generate TE (7 days) and TM (≥ 21 days) cells, and peripheral blood was collected 1h after i.v. Bodipy FL C16 injection and uptake quantified by FACS. (A) Representative plots (histogram) and average MFI (bar graph) of Bodipy FL C16 in TE and TM KbOVA-specific CD8+ OT-I+ cells from 2 experiments (n=7-8 mice/group). Bar graphs show mean ± SEM, **p <0.01. (B) Representative plots (histogram) of Bodipy FL C16 MFI in polyclonal TE (CD44hi CD62Llo), TM (CD44hi CD62Lhi), and TN (CD44lo CD62Lhi) CD8+ T cells 7 days post-infection and average MFI (bar graph) of polyclonal CD8+ T cells from 2 experiments (n=9 mice/group). Bar graphs show mean ± SEM ***p <0.001. (C) OT-I cells were activated with OVA peptide and IL-2 for 3 days and subsequently cultured in IL-15 or IL-2 for 4 more days to generate IL-15 TM and IL-2 TE cells respectively. (D) OTI cells were incubated with Bodipy FL C16 on d4-7 of culture, and uptake was measured. MFIs were normalized to the daily MFI of IL-2 TE cells. Data from 3 experiments shown as mean ± SEM, *p <0.05 by one sample t-test. (E) CD36 expression on d7 IL-2 TE and IL-15 TM cells, or polyclonal T cells. Data represent 3 experiments. (F-H) Day 6 IL-2 TE or IL-15 TM cells were cultured overnight ± oleate then stained with Bodipy. (F) Representative plots showing Bodipy MFI and (G) average Bodipy MFI from 3 experiments show mean ± SEM, *p <0.05, **p <0.01. (H) Images showing Bodipy (green) and CD8 (red) represent 4 experiments. Scale bar = 2 µM (I) OT-I cells expressing a lipid droplet-targeting construct (LD-GFP) were cultured overnight ± oleate. Images show LD-GFP (green) and CD8 (red) and represent 2 experiments. (J) Cells were incubated with Bodipy-LDL or left unstained (Control), data represent 2 experiments.

