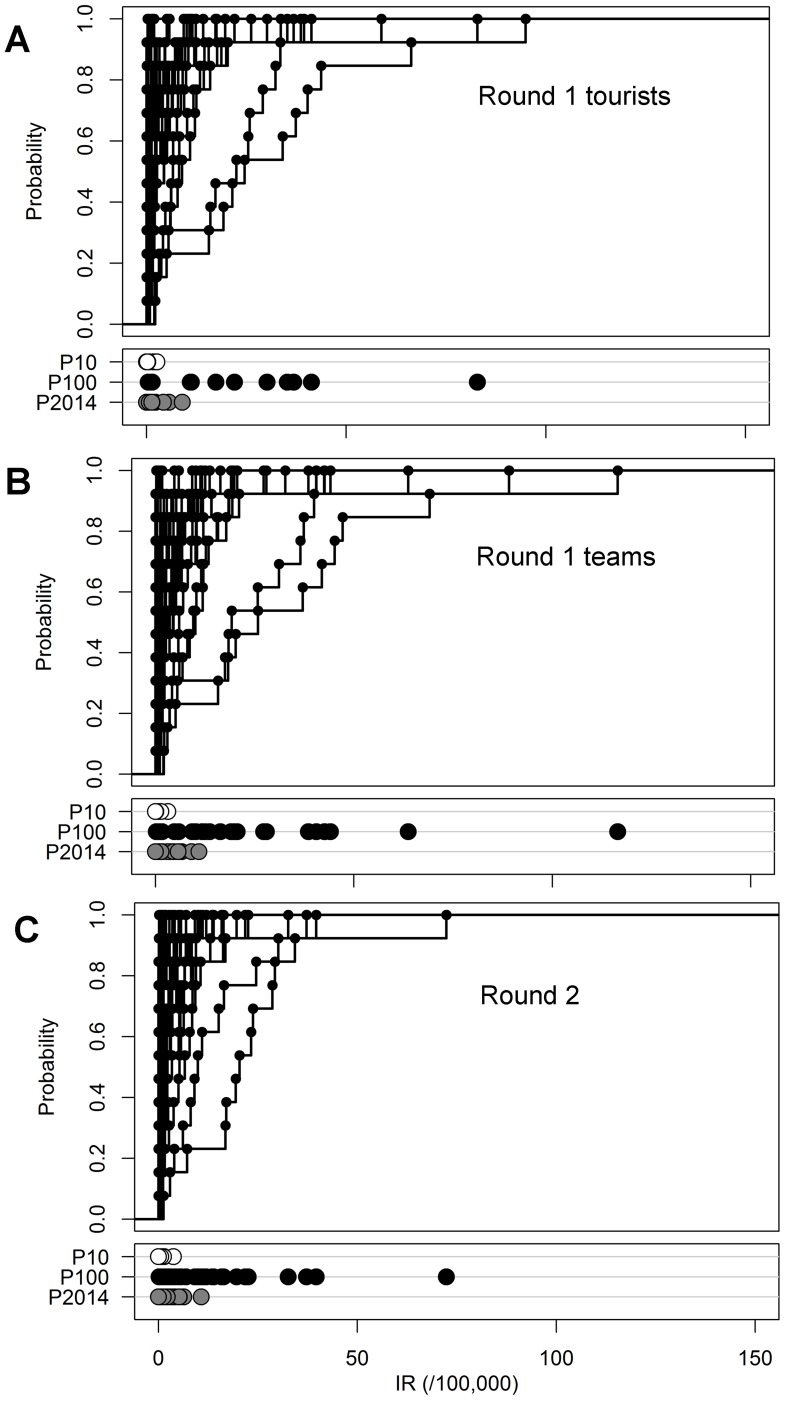
Figure 2. Probability of weekly incidence rates based on the 2001–2013 distribution for each city.
Probabilities are shown for (A) round one for tourists, (B) round one for teams, and (C) round two of the World Cup. The 10th percentile (P10), maximum (P100) and 2014 percentile (P2014) of the 2001–2013 distribution are indicated for each city in the lower panels.

