Figure 4.
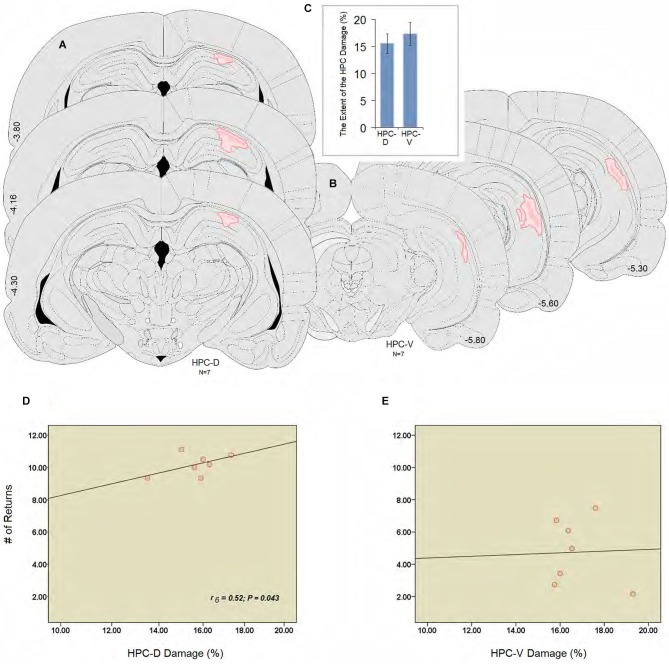
(A and B) Illustrations of the lesion observed unilaterally through the rostral and caudal extent of the hippocampus (dHPC: ~−3.80, −4.16, −4.30; vHPC: ~−5.30, −5.60, −5.80). The dark pink area represents the lesion core which is surrounded by the light pink area or penumbral zone with less tissue damage in the dorsal and ventral hippocampus. (C) Estimate of the damage percentage for the dHPC and vHPC groups in the dorsal and ventral hippocampus. Both groups were equally affected by the ET-1 infusion into the hippocampus. (D and E) Correlation between the percent damage induced by ET-1 in the dorsal (D) and the ventral (E) hippocampus, and the number of returns during spatial investigation in the ZT. The number of returns was significantly correlated to the damage percent only in the dHPC rats. Error bars show ±SEM. Atlas plates are from Paxinos and Watson (1997). HPC-D: dorsal hippocampus; HPC-V: ventral hippocampus.

