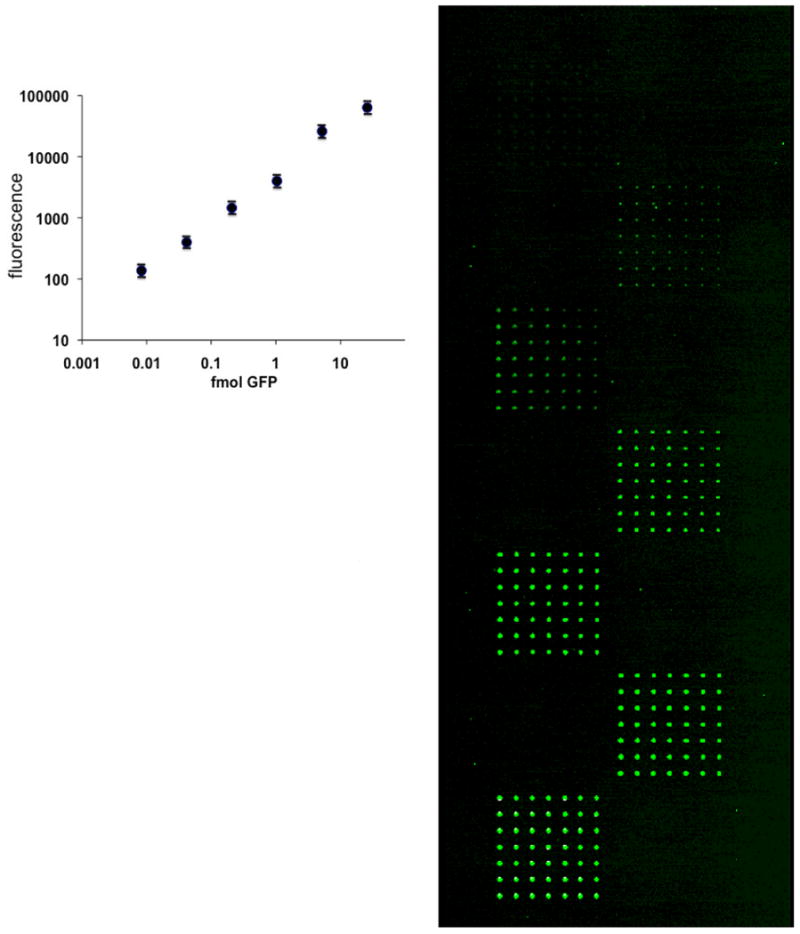
Figure 3.

Standard curve of GFP.
A printed dilution of GFP in a 7×7 grid for each subarray was used to generate a standard curve to quantitate the amount of expressed GFP and GFP-constructs for the self-assembled arrays.

Standard curve of GFP.
A printed dilution of GFP in a 7×7 grid for each subarray was used to generate a standard curve to quantitate the amount of expressed GFP and GFP-constructs for the self-assembled arrays.