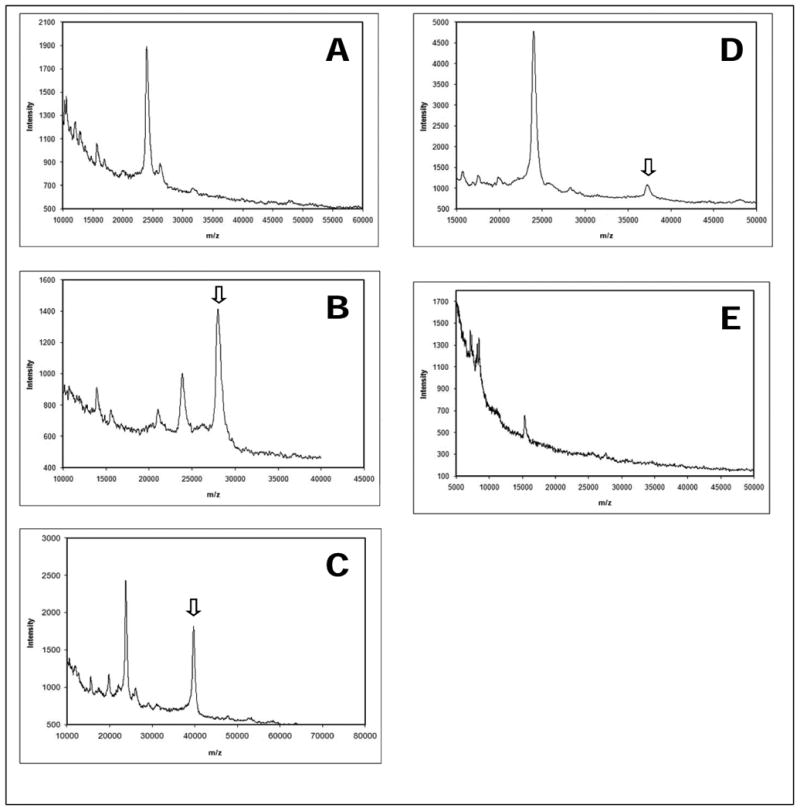
Figure 4.

MALDI spectra of self-assembled protein array elements. (A) Control spectra of spots without the expression plasmid show artifact peaks from immobilized Anti-GFP. Spots containing plasmids for expression of GFP (B), CusF-GFP (C), and SLY2-GFP (D) show peaks at the expected m/z values for full-length protein. (E) Spectra of array elements without immobilized Anti-GFP show minimal binding of contaminants from the cell-free transcription/translation mixture. Arrows in B, C, and D indicate expression of GFP, CusF-GFP, and SLY2-GFP, respectively.
