Figure 4.
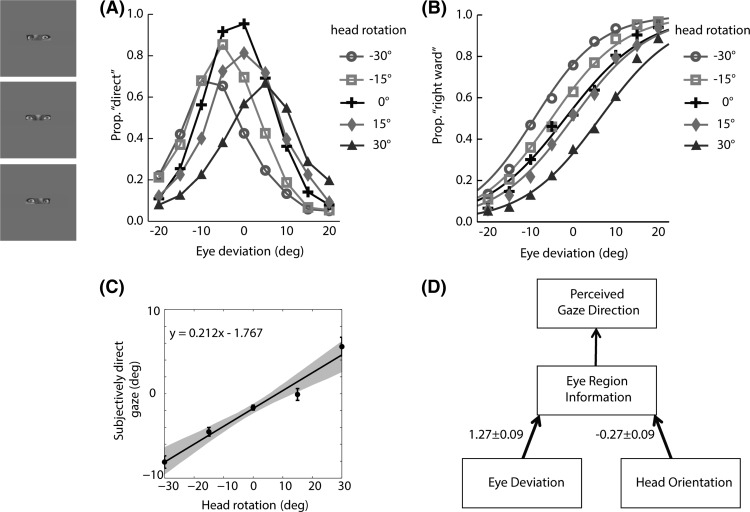
Data from the eye-region condition averaged across subjects. (A) Proportion of direct responses as a function of eye deviation for each head orientation. (B) Logistic fits to the data recoded as proportion of rightward response. (C) Points of subjectively direct gaze derived from the fitted data together with the linear regression slope across head orientation. The gray area represents bootstrapped 95% confidence intervals and the error bar represents the standard deviation between subjects. (D) Effective weights of eye deviation and head orientation on perceived gaze direction.

