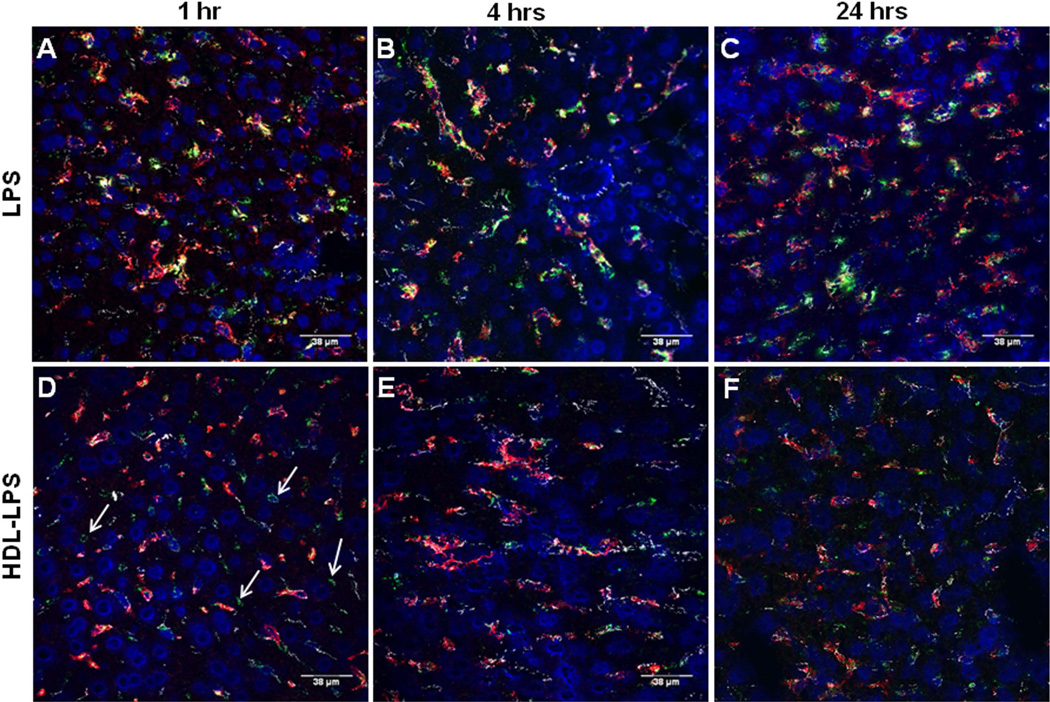
Figure 2. Uptake of FITC-LPS by liver cells.
A. Sinusoidal endothelial cell junctions were stained with anti-CD144 (VE-cadherin), which is red in this panel. FITC-LPS is green. Cell nuclei are blue (DAPI). Note that the red label outlines many of the sinusoids. B. In the same image, Kupffer cells were stained with anti-F4/80 (red). C. shows the merged image, with the VE-cadherin now shown in white. Note that the FITC (green) is almost always found in contact with Kupffer cells (arrowheads), although some is also free within the sinusoids and there is occasional extrasinusoidal FITC as well (arrow). D–E. FITC-LPS is shown 1 day (D) and 7 days (E) after FITC-LPS administration to mice that had received clodronate liposomes 48 hours before as described in Methods. FITC-LPS (green), KC (F4/80, red), SEC (VE-cadherin, white), and nuclei (DAPI, blue).

