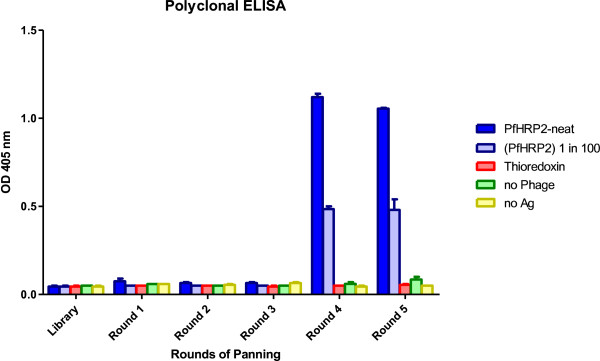
Figure 1.

Polyclonal phage ELISA. The diagram shows an increase in ELISA absorbance values in rounds 4 and 5 phage pools against neat, and 1 in 100 diluted rPfHRP2 proteins. Immobilized thioredoxin protein, no phage, and uncoated microtitre plate wells were used as negative controls.
