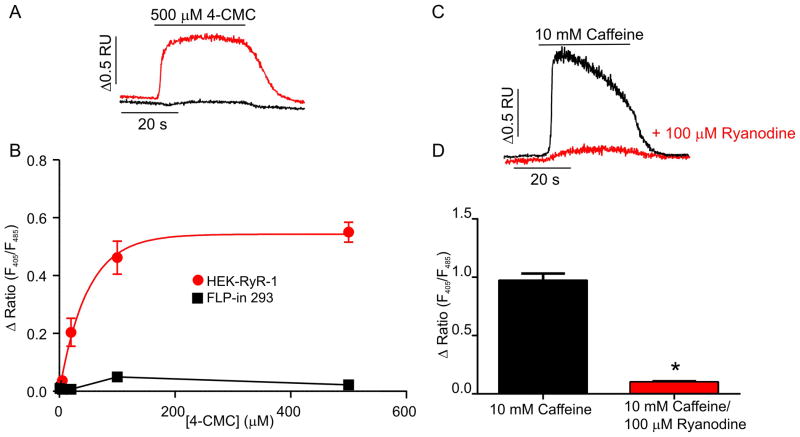
Figure 2. RyR1 Ca2+ release channel function in stable HEK-RyR1 cells.
(A) Representative indo-1 ratio traces obtained from HEK-RyR1 cells (red) and control (black) Flp-In 293 cells during application of 500 μM 4-CMC. (B) Average (± SE) 4-CMC concentration-response curves for RyR1 stably expressing (red) and control (black) Flp-In 293 cells. (C) Representative indo-1 ratio traces obtained from HEK-RyR1 cells during application of 10 mM caffeine in the absence (black) and presence (red) of pretreatment with 100 μM ryanodine. (D) Average (± SE) response of HEK-RyR1 cells to 10 mM caffeine in the absence (black) and presence (red) of pretreatment with 100 μM ryanodine. *p < 0.05.

