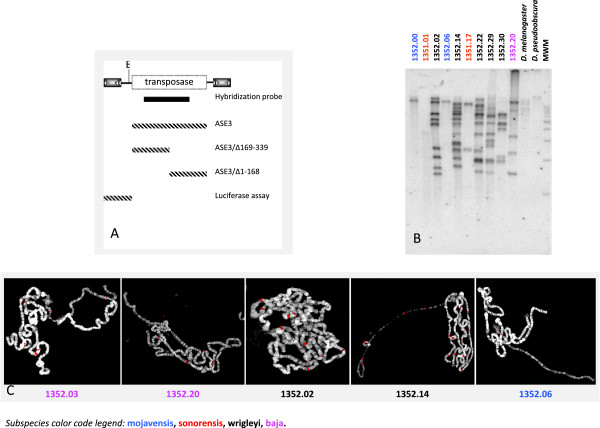
Figure 2.

Bari3 distribution in the genome of Drosophila mojavensis. A) Schematic representation of the Bari3 transposon. The EcoRI site used for the genomic analyses and the position of the probe (black bar) are showed. Dashed bars represent the transposon fragments tested in this work. B) Southern blot hybridization of DNA samples extracted from ten D. mojavensis populations MWM, 1Kb DNA molecular weight marker (Promega). C) Fluorescence In Situ Hybridization (FISH) on polytene chromosomes prepared from five D. mojavensis strains. Merged images (DAPI and Cy3) are shown. Hybridization signals are pseudo-colored in red. The subspecies color code legend reported in the bottom of the figure refers to the hybridization experiments.
