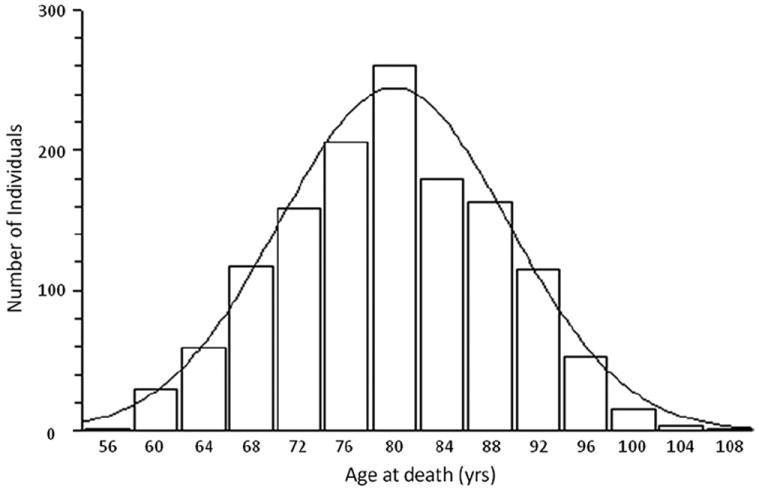
Fig. 1.

Histogram plot representing the spread of age at death (AAD) of samples included in this study. The x- and y-axis represent AAD in years and number of individuals, respectively. This graph follows a normal distribution, with mean AAD = 80.2 years (n = 1385).
