
Fig. 5.
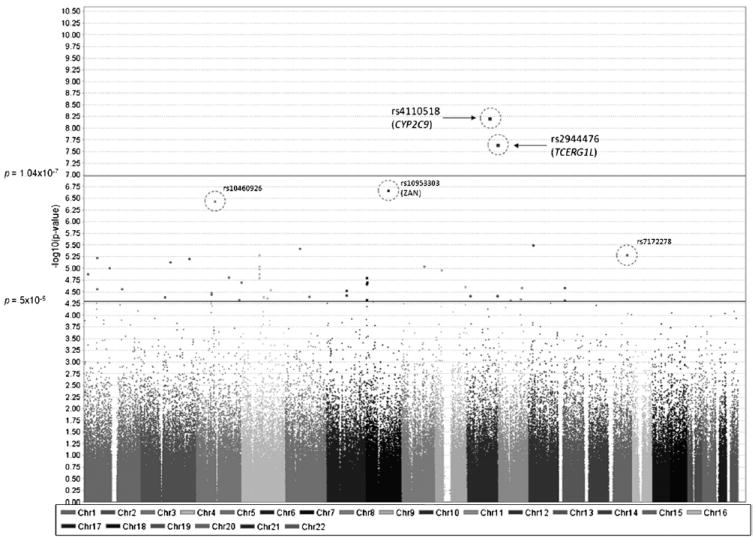
Manhattan plot of genome-wide association studies (GWAS) in human aging. Chromosomal position is shown on the x-axis versus -log10 GWAS p value on the y-axis. The threshold for genome-wide significance (p = 1.04 × 10⁻⁷) and p value threshold (p = 5 × 10⁻⁵) are indicated by the horizontal lines. Single nucleotide polymorphisms (SNPs) between these thresholds show “suggestive” associations. The 5 SNPs (highlighted by circles) exhibit significant differences in allele frequencies between samples from Mayo and Washington University (WashU) (see Fig. 4). Two of the 5 SNPs (rs4110518 and rs2944476) showed spurious genome-wide significant signals as a result of this bias.