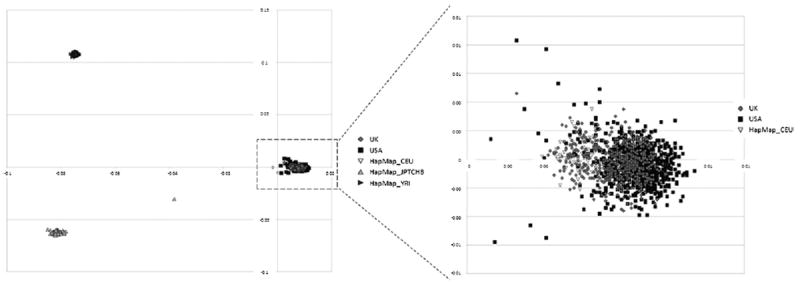
Fig. 7.

Multidimensional scaling (MDS) plot depicting the principal component analysis of Merged Data 3. Population stratification was tested using HapMap data #23 as reference. UK and USA and HapMap CEU samples formed a single cluster (shown inside the dashed rectangle). Up-pointing triangles represent Asian (CHB/JPT) population (bottom left), and right-pointing triangles represent Yoruba (YRI) population (top left). One HapMap individual from the Asian samples appears to have dual ethnicity. The diagram on the right shows a magnified section including UK, USA, and HapMap CEU samples.
