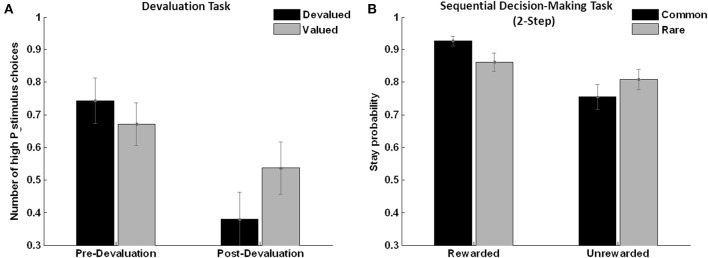
Figure 5.

Analysis of choice behavior. (A) Devaluation task: subjects show significantly more valued compared to devalued stimulus choices after devaluation in extinction (n = 14, F = 5.20, p = 0.040, error bars indicate s.e.m.), reflecting “goal-directed” behavior. (B) Sequential choice task: the same subjects show higher stay probabilities in the “rewarded common” as opposed to the “unrewarded common” trials (main effect reward: (n = 17, F = 14.1, p = 0.002), reflecting “model-based” behavior with a positive reward × frequency interaction over all subjects (n = 17, F = 6.05, p = 0.026).
