
Figure 2. Upregulation and downregulation of motor adaptation rates by environmental consistency.
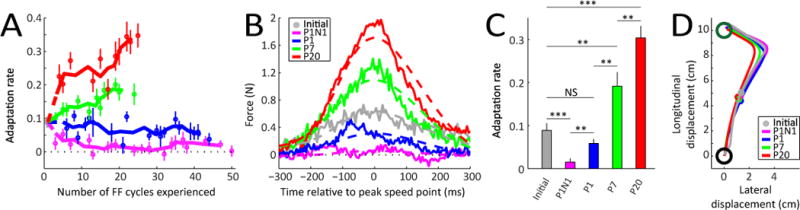
(A) Average initial adaptation rate for the P1N1, P1, P7, and P20 environments and evolution of adaptation rate in these environments as a function of the number of FF cycles experienced. Circles indicate actual data from FF cycles where the adaptation rates were measured and solid lines show a 3-point moving average. Errorbars indicate SEM across subjects.
(B) Lateral force profiles comprising the single-trial adaptive response for the different learning environments. The average learning-related change in lateral force is shown for the first cycle of the experiment averaged across experiments (gray) compared to the average FF compensation observed in the last half of the measurement FF cycles in each different environment (colors).
(C) Average initial adaptation rate for all the different learning environments (gray) compared to the last-half adaptation rates for each environment (colors). Errorbars indicate SEM. * p < 0.05, ** p < 0.01, *** p < 0.001.
(D) Average perturbed hand paths seen during the first FF trial of the experiment (gray) and in the last half of the cycles in each environment (colors). The small circles near the midway point indicate the location of the peak speed point.