
Figure 3. Environmental consistency modulates next-trial motor adaptation rates but not same-trial feedback control.
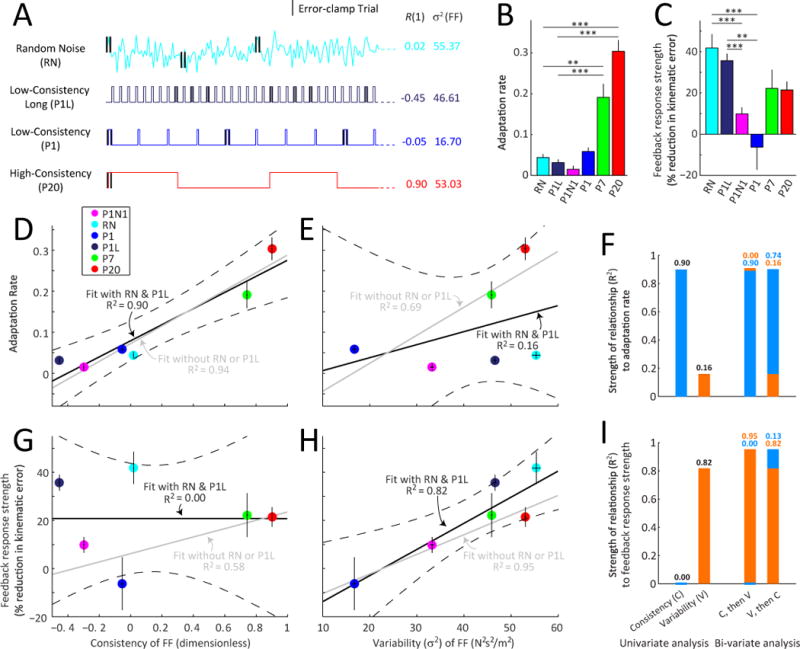
(A) Schematic of learning environments including the random noise (RN) environment. Note that the RN environment was designed to have a high variability like the high-consistency environment (P20) but at the same time a near zero consistency like the inconsistent learning environment (P1).
(B and C) Adaptation rate and feedback response strength (% reduction in kinematic error) in the last half of the P1N1, P1, RN, P7, and P20 environments. Statistical comparisons between RN and the other environments are shown (* p < 0.05, ** p < 0.01, *** p < 0.001). Errorbars indicate SEM.
(D and E) The relationships between adaptation rate and environmental consistency (D) or variability (E) across experiments. Both before (gray solid line) and after including the RN and P1L data (black solid line), environmental consistency explains a large fraction of the variance in motor adaptation rate, R2>89% in both cases. However inclusion of the RN and P1L data reduces the ability of environmental variability to explain changes in adaptation rate, reducing the R2 value from 69% to only 16%. The gray dotted horizontal line indicates the initial adaptation rate before exposure to the different environments.
(G and H) The relationship between feedback response strength and environmental consistency (G) or variability (H) across experiments in a format similar to panels D and E. Both before and after including the RN data, environmental variability explains a large fraction of the variance in feedback response strength, R2=82% when including the RN/P1L data and R2=95% without. However inclusion of the RN/P1L data reduces the ability of environmental consistency to explain changes in feedback response strength, reducing the R2 value from 58% to 0%. Errorbars indicate SEM.
(F and I) Summary of the strength of the relationships (R2) between adaptation rate (F) or feedback response strength (I) and consistency or variability. The first pair of bars summarizes the univariate regression analyses shown in panel D, E, G, and H. The 3rd and 4th bars summarize the corresponding bi-variate regressions. Here the 3rd bar shows the improvement in R2 when a univariate analysis based on consistency (C, blue) is augmented by variability (V, orange). The 4th bar shows the improvement when a univariate analysis based on V is augmented by C. Full results of the bivariate analysis are shown in tables S2 and S3. Errorbars indicate SEM.