
Figure 4. Upregulation of adaptation rates cannot be explained by savings.
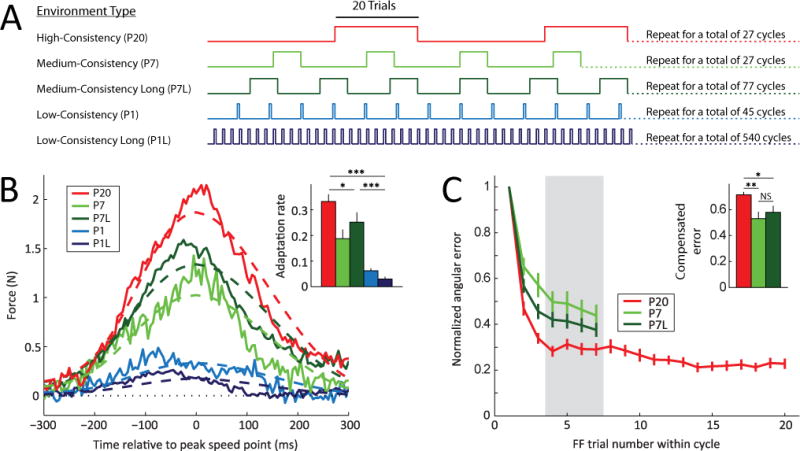
(A) Comparison of the P20 (red), P7 (light green), P7 Long (dark green), P1 (light blue) and P1L (dark blue) environments. Notice that although the number of FF cycles is the same (27) for both the P20 and P7 learning environments, the number of FF trials experienced is different, 540 vs. 189. Correspondingly, the number of FF cycles for the P1 learning environment is 45 (i.e. only 45 FF trials). The P7-Long (P7L) and P1-Long (P1L) environments were designed to match the number of FF trials of the P20 environment (540), and hence assess the influence of the number of FF trials on the observed adaptation rate increases.
(B) Lateral force profiles comprising the single-trial adaptive response in the P20, P7, P7L, P1 and P1L environments. Note that the subjects in the P7L environment, despite experiencing the same number of FF trials as those in the P20 environment, compensated less than those exposed to the P20 environment. Subjects exposed to the P1L environment compensated even less. The inset shows the average adaptation rates in the P20, P7, P7L, P1 and P1L experiments in the last third of each environment. Errorbars indicate SEM. Notice that subjects in the P20 environment exhibited adaptation rates that were significantly greater than those of subjects in all other environments.
(C) Mean angular error, a second measure of motor adaptation, in late FF cycles in the P20, P7 and P7L environments. The error in trials 4, 5, 6 and 7 (gray shaded region) of the FF cycles was significantly lower in the P20 environment than P7 or P7L. The inset quantifies these differences. Errorbars indicate SEM. * p < 0.05, ** p < 0.01, *** p < 0.001.