
Figure 5. Upregulation of adaptation rates cannot be explained by savings.
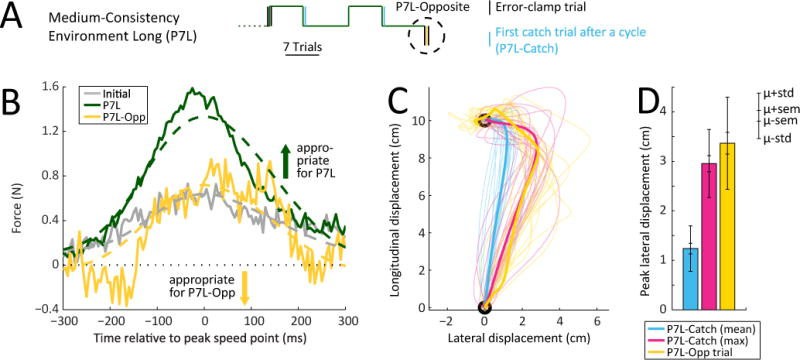
(A) Illustration of the P7L-Opposite (P7L-Opp, yellow) experiment in which a single oppositely-directed FF perturbation was presented at the end of the P7L environment. The adaptation rate for this trial was compared to the adaptation rate displayed in the last third of trials in P7L (P7L, green).
(B) Comparison of the average initial single-trial adaptive response (gray) with that observed for the last third of the P7L trials (green) and the P7L-Opposite trial (yellow). Note that in the P7L-Opposite trial, subjects produce a force compensation that is largely inappropriate for the FF experienced.
(C) Hand trajectories during the null trials immediately following FF blocks (P7L-Catch, blue: average trajectories for each subject, pink: trajectories of trials where each subject experienced their maximum deviation) compared to hand trajectories during the single P7L-Opposite trial (yellow). Thin lines indicate individual subject data; thick lines indicate data averaged across subjects. Note that the most deviated P7L-Catch trajectories are similar to the P7L-Opp ones, indicating that, while the FF experienced during the P7L-Opposite trial was completely novel, the errors it elicited were not.
(D) Peak lateral displacements / errors experienced during the P7L-Catch and P7L-Opposite trials. While on average each subject experienced weaker errors during P7L-Catch (blue), the largest P7L-Catch errors for each subject (pink) were similar to the errors experienced during P7L-Opposite. Inner errorbars indicate SEM (inner whereas outer errorbars indicate standard deviation across subjects.