
Figure 6. Synergistic interaction between repetition and consistency for learning rate upregulation.
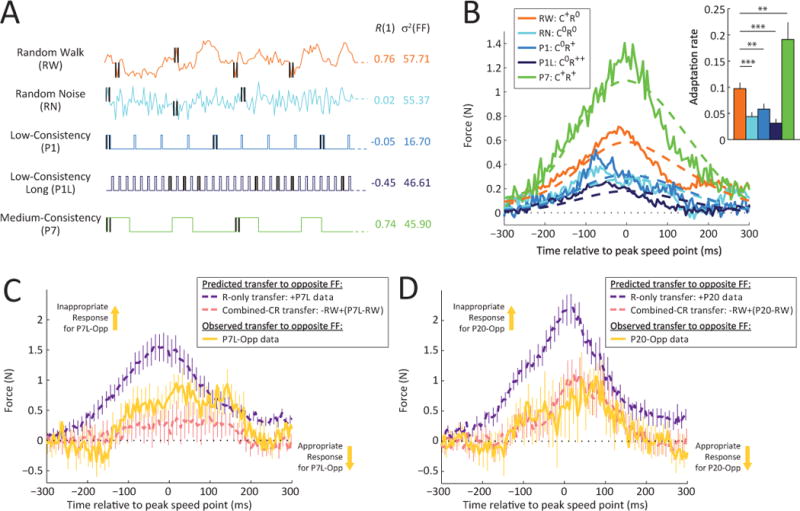
(A) Illustration of the random walk (RW) environment (orange trace). Note that this environment was designed to have a variance that is similar to that of the random noise (RN) environment (57.71 vs. 55.37), while at the same time, have a consistency similar to that of the medium-consistency (P7) environment (0.76 vs. 0.74) without having its repetitive structure.
(B) Lateral force profiles and average adaptation levels (inset) for the single-trial adaptive response in the second half of training for the RW, RN, P1, P1L and P7 environments. Note that while the force compensation in the RW environment (orange) is greater than that in the low consistency environments (RN, P1, P1L) – p<0.01 in all cases – indicating that consistency, even without repetition, leads to higher adaptation rates. However, the learning in RW does not reach the level of that in P7 (p<0.01), indicating that repetition can enhance consistency-modulated learning rate increases. Errorbars indicate SEM. * p<0.05, ** p<0.01, *** p<0.001.
(C) Repetition and consistency-driven responses combine to produce the observed P7L-Opposite response. A response predicted by the hypothesis that both consistency and repetition contribute distinct components to the adaptation (combined-CR transfer, pink dashed curve) matches the P7L-Opposite response (yellow curve) much better than a response predicted by the hypothesis that consistency enables repetition-based learning (R-only transfer, purple dashed curve). Errorbars indicate SEM.
(D) Same as (C) but for the P20 experiment, illustrating how the P20-Opposite response matches the combined-CR hypothesis rather than the R-only hypothesis.