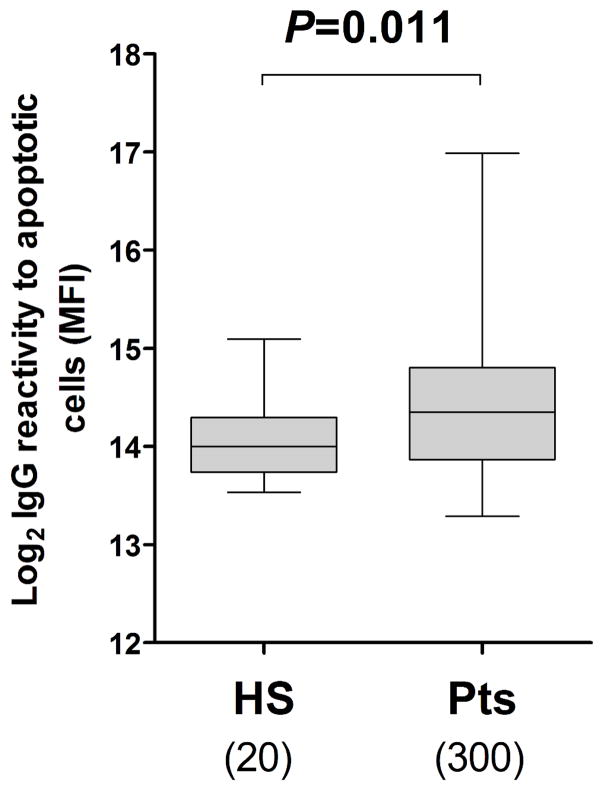
Figure 1. Pre-transplant purified IgG reactivity to apoptotic cells.
The purified IgG reactivity to apoptotic Jurkat cells was measured by flow cytometry in samples collected pre-transplant from kidney transplant recipients as well as healthy subjects. Log2 values of MFI are reported (y-axis). The numbers of samples tested in each group are shown below the box plot. The horizontal bar represents the median value; the bottom and top of each box represent the 25th and 75th percentiles; the lower and upper bars of each box represent the minimum and maximum values.

