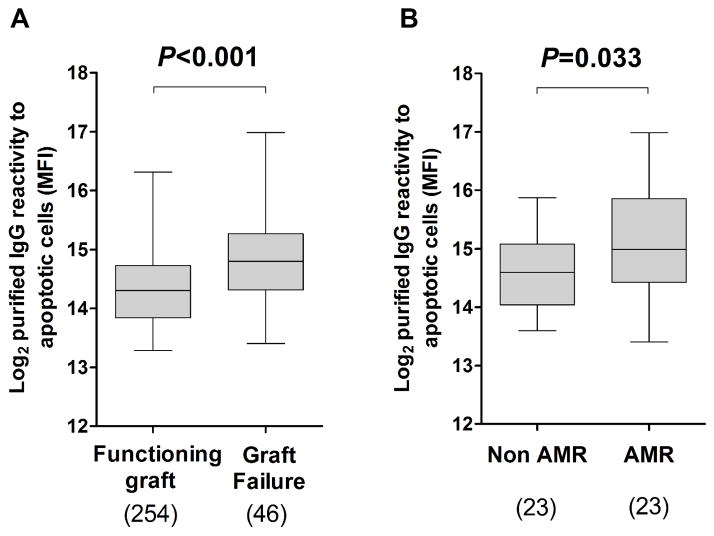
Figure 2. Pre-transplant purified IgG reactivity to apoptotic cells and graft loss.
(A) Pre-transplant IgG reactivity to apoptotic cells was compared between patients with functioning graft and patients who experienced graft loss and (B) between patients whose graft loss was attributed to AMR and patients with other causes of graft loss. The numbers of samples analyzed in each group are shown below the box plot. The horizontal bar represents the median value; the bottom and top of each box represent the 25th and 75th percentiles; the lower and upper bars of each box represent the minimum and maximum values.

