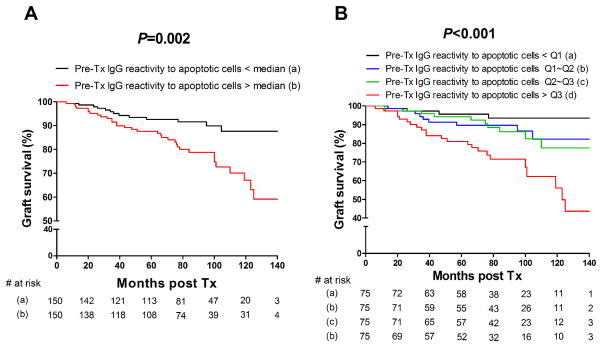
Figure 3. Pre-transplant purified IgG reactivity to apoptotic cells and graft outcome.

Kaplan-Meier cumulative, death censored, graft survival plot analyzing the effect of pre-transplant purified IgG reactivity to apoptotic Jurkat cells (A) below (black line) or above (red line) the median value. (B) below the 1st quartile (black line), between the 1st quartile and the 2nd quartile (blue line), between the 2nd and 3rd quartile (green line) or above the 3rd quartile value (red line). The number of patients at risk is shown below each time point. P value among groups was computed using log-rank (Mantel-Cox) test.
